QR Code Eye Coloring
Finder Patterns, which are located in the three corners of a QR Code, are important for determining the position and rotation of the QR Code. The size of the QR code is determined by the number of modules and can vary from 21 × 21 modules (Version 1) to 177 × 177 (Version 1). Each higher version number comprises four additional modules per side. QR Code has error correction capability to restore data if the code is partially damaged.
Four error correction levels are available (L–Low, M–Medium, Q–Quartile, and H–High). The error correction level determines how much of the QR Code can be corrupted to keep the data still recoverable (L–7%, M–15%, Q–25%, and H–30%). The QR Code error correction feature is implemented by adding a Reed–Solomon Code to the original data. The higher the error correction level is the less storage capacity is available for data. Each QR Code symbol version has the maximum data capacity according to the amount of data, character type and the error correction level. The data capacity ranges from 10 alphanumeric (or 17 numeric) characters for the smallest QR Code up to 1852 alphanumeric/3057 numeric characters for the largest QR Code at highest error correction level (Karrach et al., 2020).
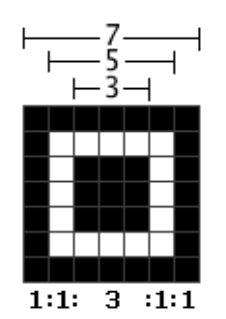
Finder Pattern based location methods locate a QR Code based on the location of its typical Finder Patterns that are present in its three corners. A shape of the Finder Pattern was deliberately chosen by the authors of the QR Code, because it was the pattern least likely to appear on various business forms and the like. They found out that black and white areas that alternate in a 1:1:3:1:1 ratio are the least common on printed materials (Karrach et al., 2020).
Most algorithms analyzed in Karrach’s article base the Finder Pattern detection on the 1:1:3:1:1 ratio detection with the identification of candidate points located in areas that fulfill said ratio horizontally, vertically and often this means diagonally (due to rotation of the code).
The existing QR code decoders require the symbol to be properly “framed”, that is, the symbol must correspond to at least 30% of the image area to be suitable for decoding. The pixels, where the brightness is lower than the threshold, are declared as 1 and the others are declared as 0.
Concern
We know the QR code eyes or finder patterns are one of the most important aspects for the camera detection, and therefore by having them clearly painted in the image we can almost guarantee a correct decoding of the code. However, we will try to camouflage them as much as possible to have the host image have more clarity.
The finder pattern detection works differently from the data modules detection. The basic idea behind the data modules detection was the grid hypothesis that the camera decoder performs: since it computes a sampling with a gaussian bell probability density, we could use the pixels outside the module center more freely. Now, the idea behind the finder pattern detection seems under a different principle: the camera groups finder pattern candidate pixels and tests if said candidate is within an area with a 1:1:3:1:1 ratio. Therefore, a tone continuous area must be found. It almost seems as if the hypothesis to be tested for finder patterns had a scope of the entire pattern area, whereas the hypothesis for data modules had a scope of the area of each module. The whole pattern area is then the section subject to a higher probability.
Approach
Following the idea of detecting such candidates inside an area of continuous tone matching a 1:1:3:1:1 ratio, we first lowered the tone of the QR pattern area by applying the data modules principle: the center of each module is painted with the dark or white relative to the mean color of the module. Then, since this was not detected due to the ideas explained, we painted each edge from the squares of the pattern with either absolute black or white. This seemed to be detected again.
We can conclude now that, for finder pattern areas, the edges of the base modules are key instead of the centers, as opposed to the data module detection where the centers were crucial.
Taking this idea, we tried to simply draw each squared area inside the finder patterns with a lighter black (0.6 opacity) and white (0.7) opacity, and its edges in pure black and white. The edges are 25% of the module $w_a$ size. Surprisingly, it takes more time for a mobile camera to decode this, but it does if you stand still for a couple more seconds than usual.
It is a matter of color then. A continuous color that, together with its surroundings, gives the impression of one color, when in reality is another. This resembles to the concept of metamerism: when two colors are perceived as the same but have different wavelengths. Therefore, the next step is to make a plot of the overall wavelength of the color signal inside the eyes of the code, and search for another spectrum that gives the same impresion of the first color. Then, once that wavelength is found, we can transform it to its equivalent RGB color and paint the eyes with it. With this, we may have a color that gives out the impression of not that contrasting, but in numerical sense it would be useful for the camera to detect.
Iteration
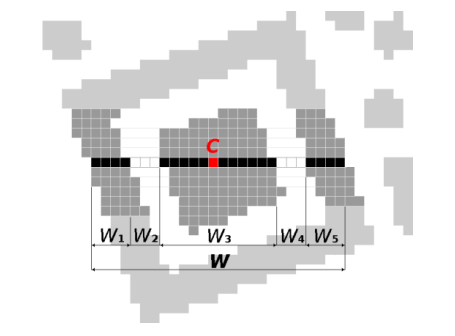
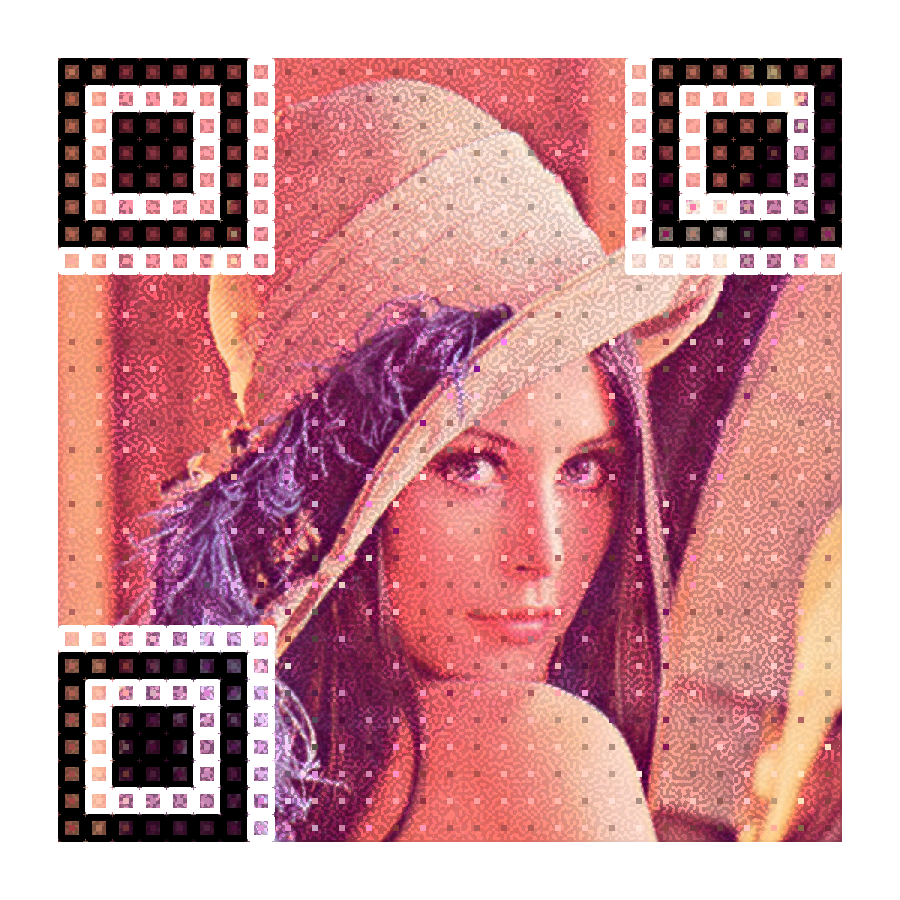
The last progress image was almost impossible to scan given different circumstances, and so the method was ditched. Another alternative that did not involve the usage of the finder pattern edges importance, but rather relies on the concept of the sub-window average luminance and average color was used to paint the totality of each of the three finder patterns. The resulting code is the following:
To get the color for each finder pattern, the first thing to do is to calculate the average black point per region, where the region is basically the 8x8 module area that constitutes the pattern (including the separation zone). This process basically computes the average of the $bp$ block matrix that was calculated for the whole image when we performed the coloring of the data modules. Then, we computed the average RGB color from the region of the pattern. The resulting RGB values are transformed to the HSL color space, in order to use the H and S values plus the region’s average black point (L value) times $1 \pm factor$ to generate a relative white and black colors, where $factor$ was in this case 0.3. Thsi process was done for each of the three finder patterns. Now, the progress’ last step is removed and instead this image is considered the next step. This was a more reliable QR code that could be scanned more normally, although requiring also a bit more time.
References
(Karrach et al., 2020) Karrach, L., Pivarčiová, E., & Bozek, P. (2020). Recognition of perspective distorted QR codes with a partially damaged finder pattern in real scene images. Applied Sciences, 10(21), 7814.